Monitoring and observability
Observability 🔎
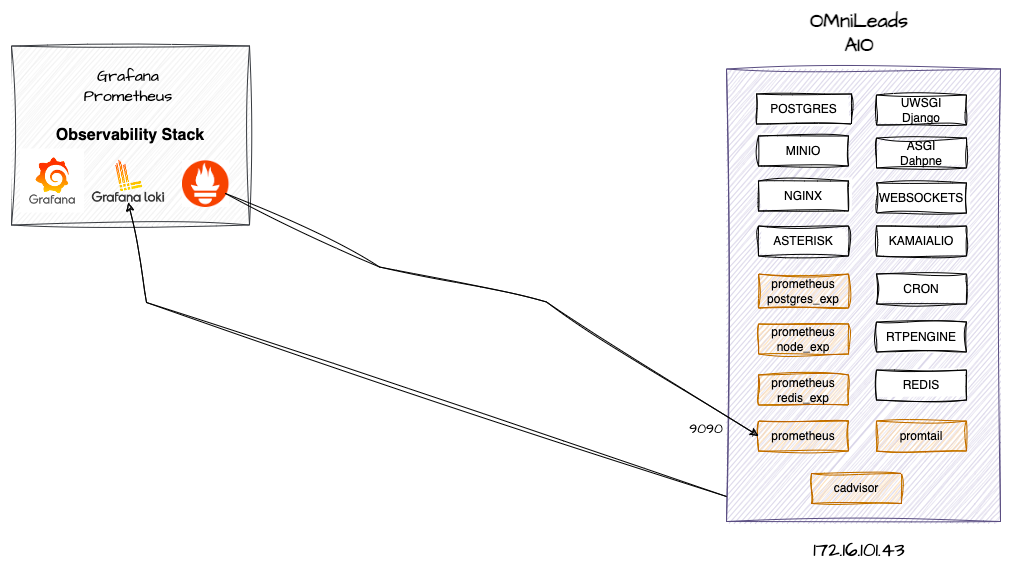
When deploying OMniLeads instances based on containers, the installation and deployment process incorporates some key components for Monitoring. These services allow not only obtaining metrics oriented to the host operating system, but also extending the observability scope to other components: redis, postgres, asterisk, among others, and centralizing logs in the Observability Stack.
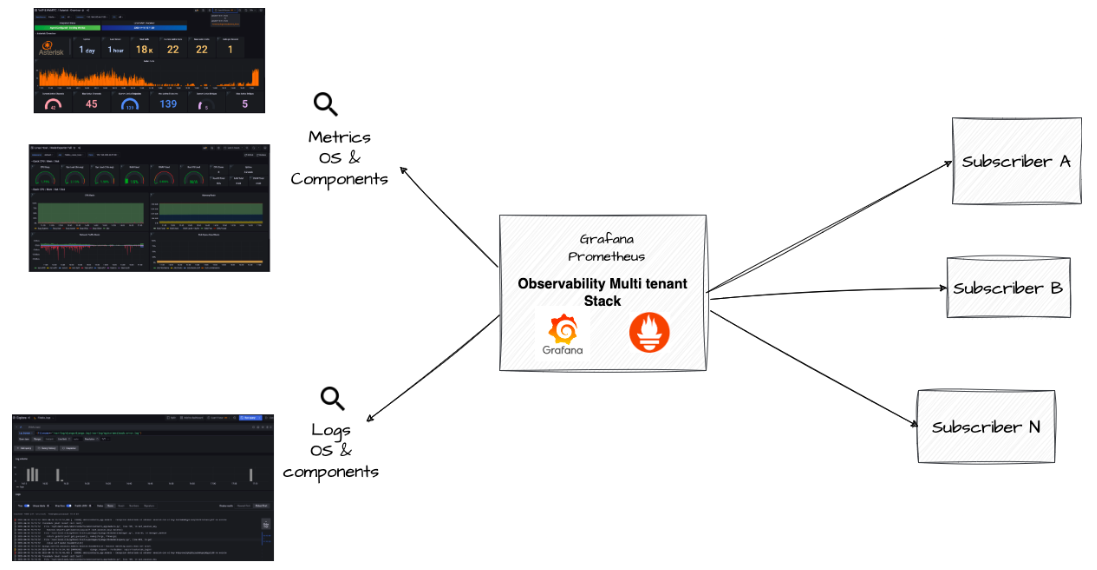
From this fact, it is possible to have a Multi-Instance Observability Center with the objective of centralizing the monitoring of different components (metrics and logs) of multiple tenants at the same time.
(centralization of logs) on the one hand, Promtail and Loki (export metrics) on the other, and to Prometheus. This is possible thanks to the benefits of
Promtail: used to parse system and application log files and send them to Loki DB.
Loki: used to store log files from OMniLeads components such as Django, Nginx, Kamailio, etc.
A real Monitoring Central
The data sources from the deployed tenants are used to build Observability Dashboards and provide log analysis stored in Loki databases. This way, the IT or technological area of a company or a cloud carrier can invoke through
This allows us to observe OMniLeads' productive environments "in detail," and provides the SRE/DevOps Engineers team with sufficient information to proactively act with their clients.
Centralized observability.
Last updated